Surplus inventory costs money every day it sits unsold. Break-even analysis helps businesses set liquidation prices that cover costs without relying on guesswork. By calculating the exact point where revenue equals total costs, you can avoid deeper losses and turn liquidation into a calculated financial decision. Here’s why it matters:
- Carrying costs add up fast: Surplus inventory can cost 20–30% of its value annually in storage, taxes, and depreciation.
- Delays hurt recovery value: Unsold items lose value over time, with some products dropping to as low as 1.4% of their original price.
- Price cuts require volume: Lowering prices shrinks profit margins, meaning you need to sell more just to break even.
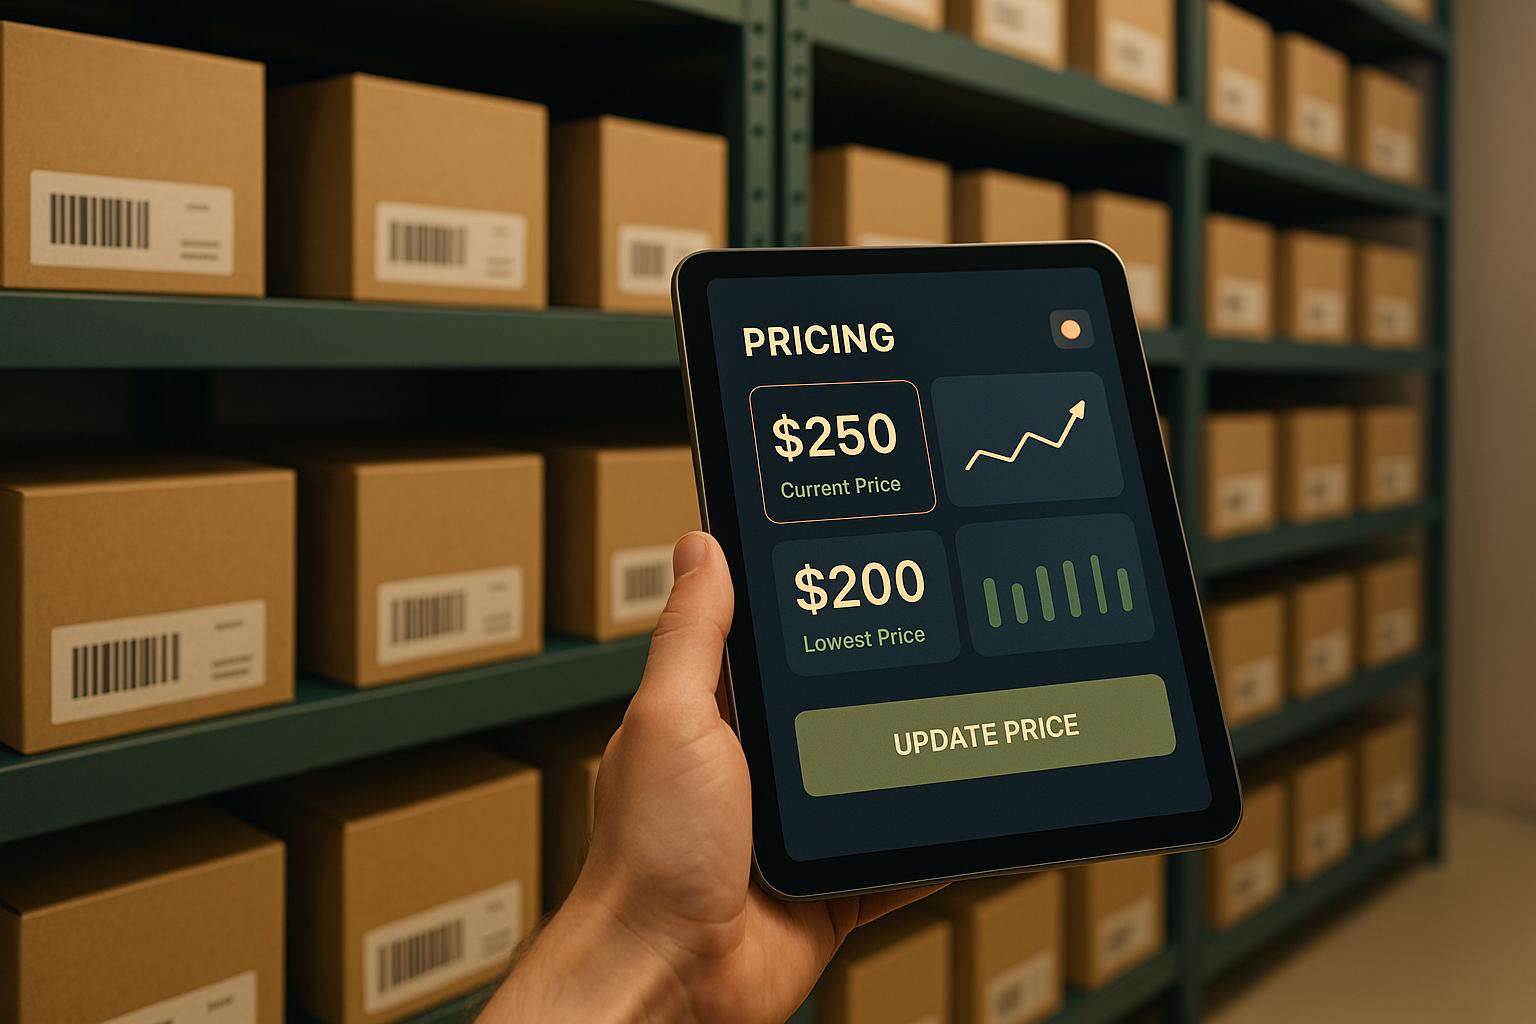
Break-even analysis ensures you set minimum prices that account for fixed costs (like rent) and variable costs (like shipping). Tools like ForthClear can simplify this by factoring in platform fees, offering bulk pricing options, and providing real-time analytics to optimize your approach.
Bottom line: Break-even analysis isn’t just about pricing - it’s about limiting losses, speeding up inventory turnover, and protecting your bottom line during liquidation.
Break-even Analysis Explained with Charts in 9 minutes
The Financial Burden of Surplus Inventory
Surplus inventory can feel like a hidden leak in your finances, quietly draining cash flow through four main costs: capital (funds tied up in inventory), storage (expenses like rent and utilities), service (insurance, taxes, IT systems), and risk (loss from shrinkage, depreciation, or obsolescence). Together, these costs directly eat into profitability, as explained below.
Inventory carrying costs typically range between 20% to 30% of the total inventory value each year. For example, holding $1 million worth of inventory could rack up $200,000 to $300,000 annually in carrying expenses. Over time, these costs can snowball, turning what might seem like a manageable issue into a serious financial strain.
How Holding Costs Cut Into Profits
When inventory sits idle, it ties up money that could be better spent elsewhere - like on payroll, marketing campaigns, or product development. FreshBooks highlights how high carrying costs directly drain cash flow. The capital cost alone - factoring in the purchase price and any interest on borrowed funds - creates opportunity costs, limiting a business’s ability to make strategic investments.
Meanwhile, warehouse expenses like rent remain fixed, regardless of how much inventory moves out the door. Add in utilities, insurance, and property taxes, and margins shrink even further. Then there’s the risk of depreciation and obsolescence, which often lead to write-offs that directly erode profits. These mounting costs make it crucial to establish a break-even liquidation price to minimize financial damage.
Revenue Loss from Delayed Liquidation
The longer you wait to liquidate surplus inventory, the steeper the losses. Every week of delay not only increases carrying costs but also reduces the potential recovery value. For instance, appliances might sell for as little as 19.2% of their original price, and clothing could drop to a mere 1.4%.
Old inventory doesn’t just lose value - it clogs up warehouse space, disrupts the flow of new stock, and drives up labor costs. This creates a snowball effect, increasing the risk of ending up with dead stock and total revenue loss. Acting quickly is essential to avoid turning surplus inventory into an irreversible financial headache. Implementing accurate pricing strategies can help minimize losses and keep inventory moving efficiently.
Using Break-Even Analysis to Set Minimum Liquidation Prices
Break-even analysis helps pinpoint the lowest price you can set to avoid further losses. It gives you a clear target for liquidation pricing and guides your sales and pricing strategies. At the break-even point (BEP), your total revenue matches your total costs. You’re not turning a profit, but you’re also not sinking deeper into losses either. This is a key step in refining pricing decisions.
The Break-Even Point Formula
To find out how many units you need to sell to break even, divide your fixed costs by the contribution margin per unit. The contribution margin is the difference between your sales price and variable costs - essentially, what’s left from each sale to cover fixed costs.
Be sure to include all variable costs, such as packaging, shipping, fees, and commissions, in your calculations. For example, Hicks Manufacturing faced $18,000 in fixed costs with a $100 sales price and $20 variable cost per unit, leaving a contribution margin of $80 per unit. To break even, they needed to sell 225 units. However, local flooding reduced their sales to just 175 units, resulting in a $4,000 loss. This highlights how falling short of the break-even point can directly impact your bottom line.
When it comes to liquidation, fixed costs often include the sunk costs of inventory already purchased and any overhead tied to the liquidation event. Variable costs, on the other hand, might include direct labor for handling surplus inventory and platform fees for selling online. The formula for liquidation pricing is:
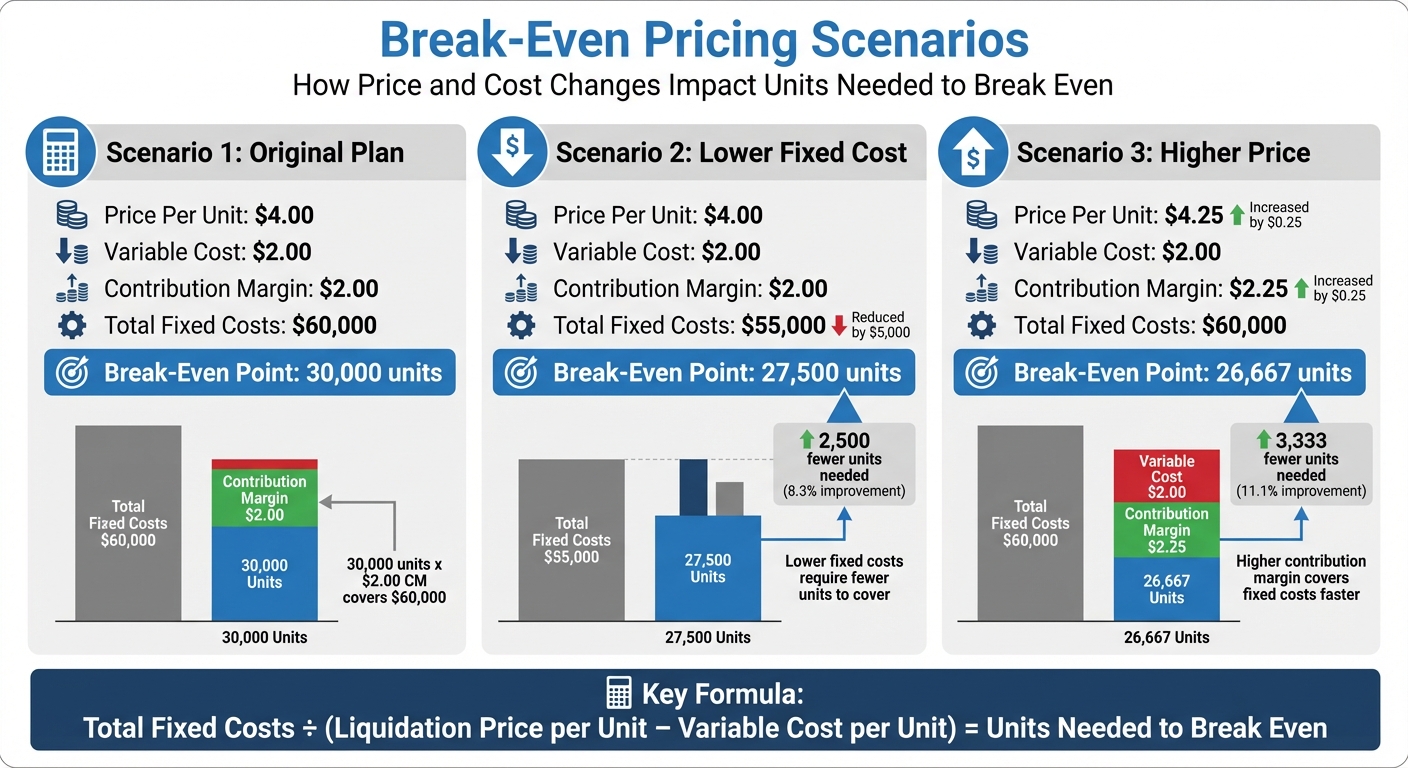
Total Fixed Costs ÷ (Liquidation Price per Unit – Variable Cost per Unit) = Units Needed to Break Even.
Calculating Break-Even in Sales Dollars
While calculating break-even in units is helpful, working with revenue targets can simplify things, especially when managing a mix of products. To calculate the break-even point in sales dollars, divide your total fixed costs by the contribution margin ratio.
The contribution margin ratio is the contribution margin per unit divided by the sales price, expressed as a percentage. For instance, if your liquidation price is $50 and variable costs are $20, the contribution margin is $30. This gives you a 60% contribution margin ratio ($30 ÷ $50). If your fixed costs are $100,000, you’d need about $166,667 in total sales revenue to break even ($100,000 ÷ 0.60).
This method is especially useful when liquidating a variety of products at different price points. Instead of calculating break-even for each SKU, you can focus on an overall revenue target for the entire liquidation effort. Keep in mind, though, that lowering prices to move inventory faster reduces your contribution margin. This means you’ll need to sell more to reach the break-even point.
sbb-itb-bc600a0
How to Apply Break-Even Analysis to Liquidation Pricing
Break-Even Pricing Scenarios for Liquidation Inventory
To determine effective liquidation pricing, start by applying break-even formulas. This involves identifying both fixed and variable costs to establish a price floor that ensures each sale covers expenses. As discussed earlier, surplus inventory can drain resources, and these calculations help pinpoint precise pricing strategies. Fixed costs include things like warehouse rent, insurance, administrative salaries, and exit costs. On the other hand, variable costs per unit cover expenses such as shipping, packaging, platform transaction fees, and sales commissions. By subtracting variable costs from the liquidation price, you can determine the unit contribution margin.
Your price floor represents the absolute minimum price you can set without losing money on each sale. Pricing below your variable costs means taking a loss with every item sold. For instance, if your fixed costs total $60,000, the sale price is $4.00, and variable costs per unit are $2.00, your margin per unit is $2.00. This means you’d need to sell 30,000 units to break even. Next, let’s examine how recovery rates differ by product category and how these differences influence break-even pricing.
Recovery Rates by Product Category
Recovery rates can vary widely depending on the type of product, and this variability plays a major role in shaping your break-even pricing strategy. For example, cash and cash equivalents often recover at 100% of their book value. In contrast, accounts receivable recovery rates range from 40% to 90%, depending on factors like the age of the debt and the creditworthiness of the customer. Inventory shows even more variation, with recovery rates spanning 20% to 80% of book value. Factors such as perishability, fashion trends, and original markups heavily influence these rates. A notable example is Neiman Marcus's 2021 bankruptcy proceedings, where Lazard’s liquidation analysis revealed that high-markup apparel could exceed 100% of its book value due to its strong market appeal, even during liquidation.
For property, plant, and equipment, recovery rates are generally lower, ranging from 10% to 70%. Specialized or customized items often require deeper discounts to attract buyers. Additionally, items with high shipping or handling costs - like heavy electronics or damaged goods - will naturally have a higher break-even price floor compared to lightweight items like apparel, which have lower variable costs. Retail clothing, with markups often ranging from 2x to 4x the initial cost, can sometimes achieve recovery rates above 100% of book value.
Break-Even Pricing Scenarios
Different combinations of pricing and cost structures can significantly affect the number of units you need to sell to cover your costs. The table below illustrates how these variations play out:
| Scenario | Price Per Unit | Variable Cost | Contribution Margin | Total Fixed Costs | Break-Even Point (Units) |
|---|---|---|---|---|---|
| Original Plan | $4.00 | $2.00 | $2.00 | $60,000 | 30,000 |
| Lower Fixed Cost | $4.00 | $2.00 | $2.00 | $55,000 | 27,500 |
| Higher Price | $4.25 | $2.00 | $2.25 | $60,000 | 26,667 |
"If a product's market-accepted sales price is greater than its break-even price, then the business can feel more confident in the financial feasibility of offering the given product." – Alice Roach, Senior Research Associate at the University of Missouri
To refine your strategy, conduct sensitivity analyses to evaluate how changes in shipping costs or pricing affect the number of sales required to break even. The difference between your actual sales and break-even sales is known as your margin of safety. By understanding these scenarios, you can better optimize your liquidation approach using the right tools and platforms.
How ForthClear Helps Achieve Above Break-Even Pricing
After figuring out your break-even point, the next step is creating a liquidation strategy that pushes you past that threshold. ForthClear’s platform is built to help sellers keep their pricing above the break-even mark while efficiently moving inventory. With tools like bulk pricing options, secure payment systems, and real-time analytics, sellers can prioritize profitability over simply minimizing risks. It’s also crucial to account for platform fees early on to calculate net recovery and set realistic pricing goals.
Calculating Net Recovery After Platform Fees
When selling on ForthClear, it’s important to factor in transaction fees as part of your variable costs. The platform charges a 5% fee, plus an additional 2.9% + $0.30 per transaction. This means your total variable cost per sale includes 7.9% + $0.30 in fees, which directly impacts your unit contribution margin - the amount each sale contributes toward covering fixed costs.
Let’s break this down with an example. Say you’re selling surplus electronics at $50.00 per unit, and you have $15.00 in other variable costs (like shipping and packaging). Adding ForthClear’s fees, your total variable cost becomes $19.25 ($50.00 × 0.079 + $0.30 + $15.00). That leaves you with a contribution margin of $30.75 per unit. If your fixed costs are $30,000, you’d need to sell 976 units to break even ($30,000 ÷ $30.75). By including these fees in your calculations upfront, you can set pricing targets that ensure you’re not just breaking even but also turning a profit. This ties back to the earlier point about exceeding your break-even point.
ForthClear’s bulk pricing feature makes achieving above-break-even pricing easier than relying on across-the-board discounts. Instead of slashing prices for everyone, you can use tiered volume discounts - like offering 30% off for buying three units or 50% off for five units. This strategy encourages larger purchases while maintaining higher margins on smaller orders. It also helps lower per-unit variable costs, such as shipping and transaction fees. As Rami Ali, Senior Product Marketing Manager at NetSuite, puts it:
"In general, higher sales prices, lower variable costs, and lower fixed costs lead to a lower break-even point".
Once you’ve nailed down your net recovery, the next priority is speeding up the liquidation process.
Tools for Faster Liquidation
Time is money, especially in liquidation, where holding costs can pile up daily. ForthClear addresses this by offering secure escrow services and a verified supplier network, which eliminate risks like fraud, non-payment, and disputes. This means you don’t have to inflate prices to account for potential losses, allowing you to stick to pricing that stays above your break-even point without resorting to deep discounts.
The platform’s real-time tools and quote negotiation features help sellers close deals quickly while maintaining pricing integrity. For example, direct messaging lets you respond instantly to buyer inquiries, while the order tracking system ensures transparency throughout the transaction. These tools streamline the sales process, helping you avoid delays that could increase holding costs. Plus, the sales analytics dashboard automates cost tracking and offers sensitivity analysis, so you can easily model how different pricing scenarios affect your break-even point. This data-driven insight allows you to pinpoint which product categories need higher recovery rates and adjust your strategy on the fly.
Conclusion
Break-even analysis highlights the sales volume or revenue you need to cover costs and safeguard your bottom line. Instead of relying on gut instincts, it provides a precise threshold to avoid losses. As Rami Ali pointed out, this analysis pinpoints the critical point you must exceed to achieve profitability, empowering you to make informed, strategic decisions rather than resorting to rushed discount sales.
Beyond the basics, break-even analysis allows you to refine your approach by testing various pricing strategies. By modeling "what-if" scenarios - like tiered discounts or reduced shipping costs - you can fine-tune the number of units needed to turn a profit. This kind of sensitivity analysis ensures you're not just breaking even but actively generating returns.
ForthClear's platform complements this process by offering tools like transparent fee structures, bulk pricing options, and real-time analytics to help maintain profitable pricing. Features such as a secure escrow system and a verified supplier network reduce risks that can inflate costs, while the sales dashboard automates cost tracking, enabling you to adjust strategies based on market trends. When paired with break-even analysis, these tools help recover capital, speed up inventory turnover, and support efficient commerce. Together, they demonstrate the power of combining data-driven insights with practical solutions.
The margin of safety - the gap between your actual sales and the break-even point - serves as your financial cushion during liquidation. A wider margin gives you the flexibility to experiment with competitive pricing while still covering costs. Striking this balance not only protects your profit margins but also promotes responsible liquidation practices, ensuring surplus goods are sold profitably while staying out of landfills.
FAQs
How does break-even analysis influence pricing for liquidation sales?
Break-even analysis is a powerful tool for figuring out the lowest price you can charge to cover all your costs - both fixed and variable. It ensures that even when you're liquidating inventory, you’re not selling at a loss and can recover your expenses.
Knowing your break-even point allows you to price surplus inventory strategically. Whether your goal is simply to cover costs or to bring in extra revenue, this method helps you make informed decisions. It’s an effective way to manage surplus stock while minimizing waste.
What are the key costs of holding surplus inventory?
Holding onto surplus inventory can chip away at profitability more than you might think. It’s not just about the goods sitting idle; there are storage fees for warehouse space, labor costs for handling and managing items, and transportation expenses for moving them around. Add to that the price of insurance premiums, property taxes, and depreciation as products lose value over time. Don’t forget shrinkage, which accounts for losses due to theft or damage. Then there’s the opportunity cost - the capital tied up in unsold goods could be put to better use elsewhere.
For many U.S. businesses, these carrying costs can pile up quickly, adding 20–30% to inventory expenses and eating into as much as 11% of annual revenue if surplus stock lingers too long. Platforms like ForthClear offer a smart solution by helping companies liquidate excess inventory. This frees up space, slashes carrying costs, and allows businesses to reinvest that working capital into growth-focused initiatives.
How does break-even analysis help set effective liquidation prices?
Break-even analysis is an essential method for figuring out the lowest price you can set to cover all costs when clearing out surplus inventory. It takes into account fixed costs like storage and handling, as well as variable costs such as the purchase price per unit and packaging. This helps businesses determine a pricing floor that avoids losses.
Tools like ForthClear make this process easier by offering real-time inventory tracking, access to sales data, and pricing scenario modeling. Sellers can create bulk pricing or discounts that stay above the break-even point while taking advantage of features like secure escrow payments and verified supplier networks to attract buyers. This strategy not only speeds up the liquidation process but also helps recover more value, maintain cash flow, and free up warehouse space effectively.