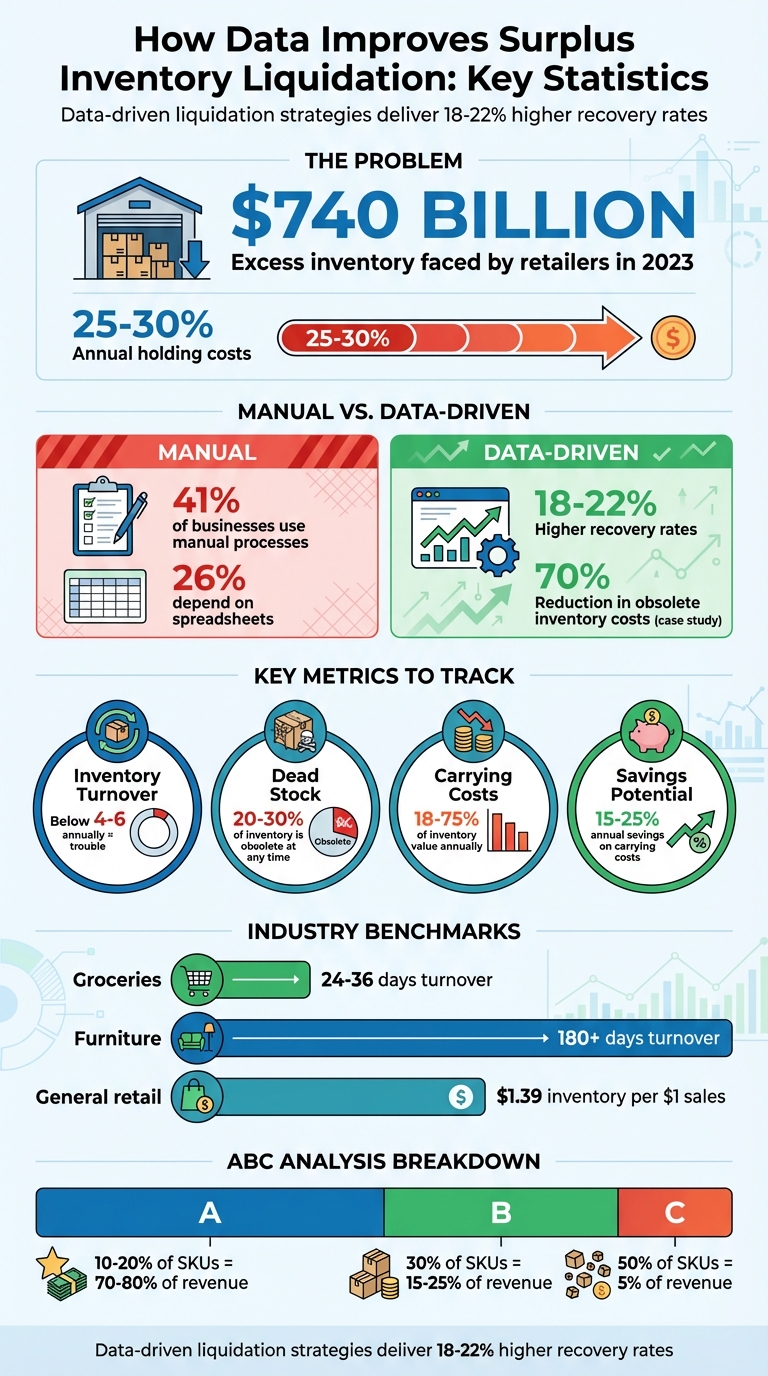
Surplus inventory is expensive, but data can help you recover more value. Retailers in 2023 faced $740 billion in excess goods, with holding costs reaching 25–30% annually. Data analytics offers a smarter way to manage this issue by optimizing liquidation timing, channels, and pricing.
Here’s how data makes a difference:
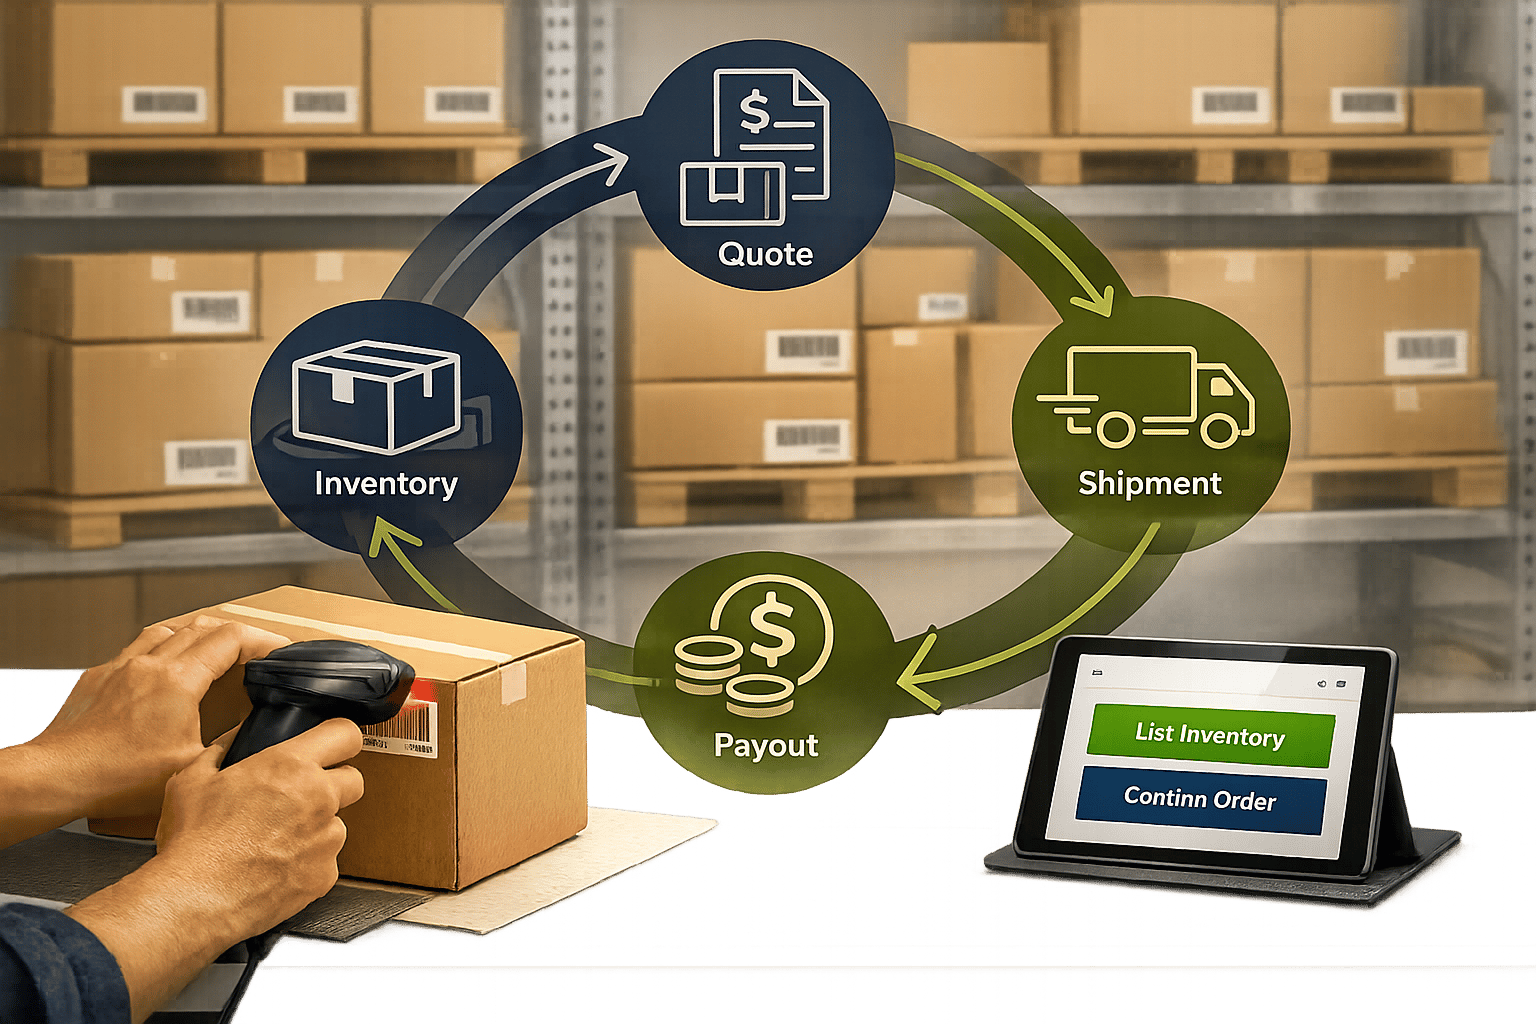
- Identify surplus early: Real-time inventory tools and metrics like turnover rates and Days Sales of Inventory (DSI) help spot slow-moving stock.
- Segment inventory: Techniques like ABC analysis focus efforts on high-priority items while clearing out low-value stock.
- Use demand forecasting: Predictive analytics times liquidation to maximize returns before value drops.
- Choose the right channels: Data-driven decisions direct inventory to the most profitable sales platforms, including B2B marketplaces and international markets.
- Track metrics post-sale: Recovery rate, cycle time, and sell-through rate ensure continuous improvement.
Retailers using data recover 18–22% more value from excess inventory. Tools like ForthClear simplify the process with automated stock identification, buyer networks, and secure payments. By turning liquidation into a data-backed process, businesses save money, free up space, and reinvest in better opportunities.
Data-Driven Surplus Inventory Liquidation: Key Statistics and Recovery Metrics
Liquidation Heroes: How Top CPGs Turn Distressed Inventory into Opportunity
How to Identify Surplus Inventory Using Data
Using data effectively is the foundation of managing surplus inventory. To start addressing surplus stock, you need a clear picture of what you have and where it’s located. Relying on manual methods, like spreadsheets or physical counts, often leads to mistakes that can cost businesses dearly. Did you know that 41% of businesses still use manual processes for inventory management, and 26% depend on spreadsheets? This outdated approach not only wastes time but also ties up cash in unsold goods, leaving businesses unaware of potential issues. Modern tools, however, offer real-time insights that can help identify problem areas quickly and accurately.
Track Stock Levels with Inventory Management Tools
Inventory management software takes the guesswork out of the process by consolidating all vital product data in one place. These systems provide real-time dashboards that show you what’s in stock, what’s running low, and how long items have been sitting in your warehouse. For example, automated aging reports categorize inventory into time-based buckets (like 0–30 days, 31–60 days, or 90+ days), making it easy to spot items that are gathering dust.
Take the case of Central City Electronics in 2020. This home-electronics retailer had to write off hundreds of thousands of dollars in outdated 1080p LCD televisions because a purchasing manager over-ordered to secure a bulk discount. After adopting an inventory management system with real-time visibility, the company was able to cut obsolete inventory costs by 70% in just two quarters.
To further refine your approach, focus on two critical metrics: Inventory Turnover Ratio and Days Sales of Inventory (DSI). The turnover ratio is calculated by dividing Cost of Goods Sold (COGS) by Average Inventory, while DSI measures how many days it takes to sell your stock: (Average Inventory ÷ COGS) × 365. A turnover ratio below 4–6 annually signals trouble. Keep in mind that thresholds vary by industry - groceries should turn over stock every 24–36 days, while furniture might take 180+ days.
Define Clear Parameters for Dead Stock
Once you’ve analyzed stock data, it’s important to categorize surplus inventory. Not all surplus is created equal. Some products are slow-moving and may benefit from targeted promotions, while others - like dead stock - have no demand and little to no recoverable value. This distinction is crucial because each type of surplus requires a different strategy.
Many businesses follow the one-year rule: inventory that hasn’t turned over within a year is classified as dead stock and treated as a liability. However, waiting an entire year comes at a cost. Carrying inventory can eat up 18% to 75% of its value annually, depending on your situation. To avoid these expenses, consider setting stricter thresholds tailored to your industry. Use tools like conditional formatting to create heat maps, marking items with high DSI (e.g., red for over 90 days, yellow for 60–90 days). This visual approach helps teams quickly identify problem areas.
"Ignoring slow-moving inventory isn't just a minor operational oversight - it's a major profit killer that compounds over time." - Geoff Whiting, Red Stag Fulfillment
The numbers don’t lie: 20% to 30% of a business's inventory is obsolete at any given time. By using data-driven tools to identify problem stock early, you can save between 15% and 25% annually on carrying costs. The trick is to act while the inventory still holds value - before it becomes worthless.
Use Demand Forecasting to Time Your Liquidation
Timing is everything when it comes to liquidation. Sell too soon, and you might miss a seasonal upswing. Wait too long, and you could face mounting storage fees and diminishing inventory value. The key? Leverage predictive analytics to anticipate when demand will dip - allowing you to act before your surplus loses its worth. This strategy relies on analyzing historical trends and using forecasting tools to pinpoint the optimal liquidation window.
Analyze Historical Sales and Seasonal Patterns
Looking at historical sales data can uncover patterns that guide your liquidation decisions. By applying quantitative forecasting - which examines 12-24 months of data - you can identify seasonal highs and lows, helping you determine when demand for specific products typically drops. A particularly useful tool is the seasonal index, calculated with the formula: (Seasonal Average / Grand Average) x 100. This metric smooths out inconsistencies and highlights underperforming months. For instance, if your winter clothing line has a seasonal index of 60 in April, it’s a clear sign to liquidate before summer kicks in. Recognizing these trends early allows you to sell off inventory while it still holds value.
Take the example of a consumer goods company that used demand planning to navigate a potential port strike. By accelerating orders, they hit record holiday sales.
Predictive analytics goes a step further by uncovering the root causes of demand shifts. Whether it’s the end of a product’s lifecycle, changing customer preferences, or regional trends, understanding these factors helps you time liquidation based on actual demand rather than arbitrary deadlines. A declining inventory turnover ratio, for instance, is a strong indicator that it’s time to act.
"Knowing why demand is going to spike allows decision-makers to circumnavigate new information, providing more control over how they interpret demand forecasting."
– MJV Team
Prevent Future Overstock with Demand Prediction
Forecasting isn’t just about managing today’s surplus - it’s also about avoiding tomorrow’s overstock. Modern demand forecasting tools consider variables like upcoming promotions, product launches, and even external factors like economic shifts or social media trends. This proactive approach helps businesses sidestep recurring inventory issues.
AI-powered demand planning is changing the game. With tools like generative AI and digital assistants, inventory management is becoming faster and more precise. In fact, 64% of supply chain leaders report improved workflows, and decision-making volume is projected to grow by 21% by 2026. A great example is Novolex, which adopted IBM Planning Analytics in 2021. By doing so, they slashed data processing time from weeks to hours and cut excess inventory by 16%, thanks to better visibility into capacity and market demand.
To avoid future surpluses, consider using weighted moving averages, which give more weight to recent sales data. Additionally, adjust your inventory parameters whenever demand or lead-time variability shifts by ±10%.
"Inventory forecasting is a safeguard against under- or overstocking. When employed effectively, this practice reduces waste and helps ensure that cash is not tied down unnecessarily."
– Simon-Kucher
In short, demand forecasting equips you with the insights needed for smarter decisions. By combining historical data with forward-looking tools, you can time liquidations to recover maximum value while preventing new inventory challenges. Pair these insights with precise inventory segmentation to further refine your approach and enhance outcomes.
Segment Your Inventory to Prioritize Liquidation
After demand forecasting, the next step is to segment your inventory based on value and movement patterns. This helps you focus on liquidating items strategically - targeting high-return products while quickly clearing out low-value stock that’s tying up resources.
Data shows that 20% of stocked items typically account for 80% of total sales value. This means a large portion of your warehouse space is likely filled with items that contribute little to your revenue. For context, US retailers hold about $1.39 in inventory for every $1 of sales. By identifying which items to prioritize for liquidation, you can free up working capital and make room for better-performing products. Segmentation is the foundation for smarter, more targeted decisions.
Apply ABC Analysis for Better Prioritization
ABC analysis is a proven method for categorizing inventory using the Pareto Principle. It divides your stock into three tiers based on annual consumption value - calculated by multiplying the annual sales volume of an item by its cost per unit. Here's how it breaks down:
- Category A items: These are your top performers, generating 70-80% of revenue while making up only 10-20% of your SKUs. Handle these items carefully during liquidation to maximize recovery.
- Category B items: These contribute 15-25% of revenue and represent about 30% of your inventory. They’re mid-priority for liquidation.
- Category C items: These make up roughly 50% of stock but account for just 5% of revenue. These are prime candidates for aggressive liquidation.
For even better results, combine ABC analysis with HML (High, Medium, Low) velocity tracking, which measures how quickly items sell. This creates a classification matrix that highlights areas of opportunity. For example, in 2025, Tempcon Instrumentation Ltd analyzed over 4,000 SKUs using this approach. Their director, Steve Copeland, found that fewer than 100 high-value, fast-moving items needed primary focus, while the data also revealed low-value, fast-moving products they had been under-ordering.
Additionally, identify "X-class" items - deadstock with no movement - for immediate liquidation to free up space. Before running any analysis, filter out obsolete items (unsold for 24+ months) and non-stocked items ordered only on demand. This ensures your focus remains on active inventory.
"By categorizing products based on their value and usage, you have greater insight into what slow-moving products you're losing money from, so you can discount them and make room for more profitable products."
– Jara Moser, Digital Marketing Manager, Shopventory
Monitor Key Performance Indicators (KPIs)
Tracking the right KPIs is essential for effective liquidation. Here are a few metrics to keep an eye on:
- Sell-through rate (STR): This measures the percentage of received inventory sold within a specific timeframe. A healthy STR exceeds 80%; anything lower signals items that may need liquidation.
- Weeks of supply: This tells you how long your current stock will last at the current sales pace, helping you identify slow movers.
- Gross Margin Return on Investment (GMROI): This shows how much profit you earn for every dollar spent on inventory. A GMROI below 1.0 indicates you’re selling items at a loss, making them clear liquidation candidates.
- Days Inventory Outstanding (DIO): This metric reveals how long stock sits before selling. High DIO numbers point to stagnant inventory that’s costing you in storage fees.
For your most valuable items (Category A), aim to keep a stockout rate below 10%. To avoid running out of these top sellers while clearing less valuable stock, use the safety stock formula:
(Max Daily Sales x Max Lead Time) - (Average Daily Sales x Average Lead Time).
Review your inventory segmentation quarterly or biannually to account for seasonal trends and shifts in consumer demand. For slow-moving Category C items, consider bundling them with popular Category A or B products. This can increase their appeal and help you clear them out faster.
sbb-itb-bc600a0
Choose the Right Liquidation Channels and Pricing
Once you've segmented your inventory, the next step is deciding where to sell it and at what price. This decision should be driven by data, ensuring that each type of inventory is directed to the most profitable sales channel.
The choice of a liquidation channel largely hinges on your target market and the kind of buyers you're aiming to reach. For example, flash sales might appeal to individual consumers hunting for bargains, while B2B marketplaces are ideal for connecting with verified bulk buyers who can handle large transactions. Aligning your inventory profile with buyer data is key - tailored channels can yield better returns.
Data analysis plays a critical role here. By examining SKU-level details like stock age, inventory levels, and current market prices, you can make smarter decisions about where to sell. Holding onto idle stock can be costly, with carrying expenses like insurance, handling, and obsolescence adding up to 25–30% annually. This makes it even more important to act quickly and use data-driven insights to choose the right channels.
Set Prices Based on Secondary Market Data
After selecting the proper sales channel, the next challenge is pricing your inventory competitively. Pricing in the secondary market requires a deep dive into historical sales patterns and buyer preferences. Predictive pricing models, which leverage years of sales data, can help you navigate the factors that determine whether your inventory moves quickly or stagnates. This approach minimizes the risks of underpricing or overpricing.
Tiered bulk pricing is a proven strategy that uses buyer behavior trends to encourage larger purchases. Quote-enabled platforms allow buyers to negotiate quantities in real time, adding flexibility to the process. Dynamic pricing models further refine this by adjusting prices based on the channel - whether wholesale, export, or discount retail - ensuring maximum margins while avoiding market saturation. For international sales, strategies like global arbitrage can route inventory to regions where certain categories fetch higher prices. Automated tools that estimate tariffs for cross-border transactions can also help you decide whether international liquidation makes financial sense.
Streamline Liquidation with ForthClear
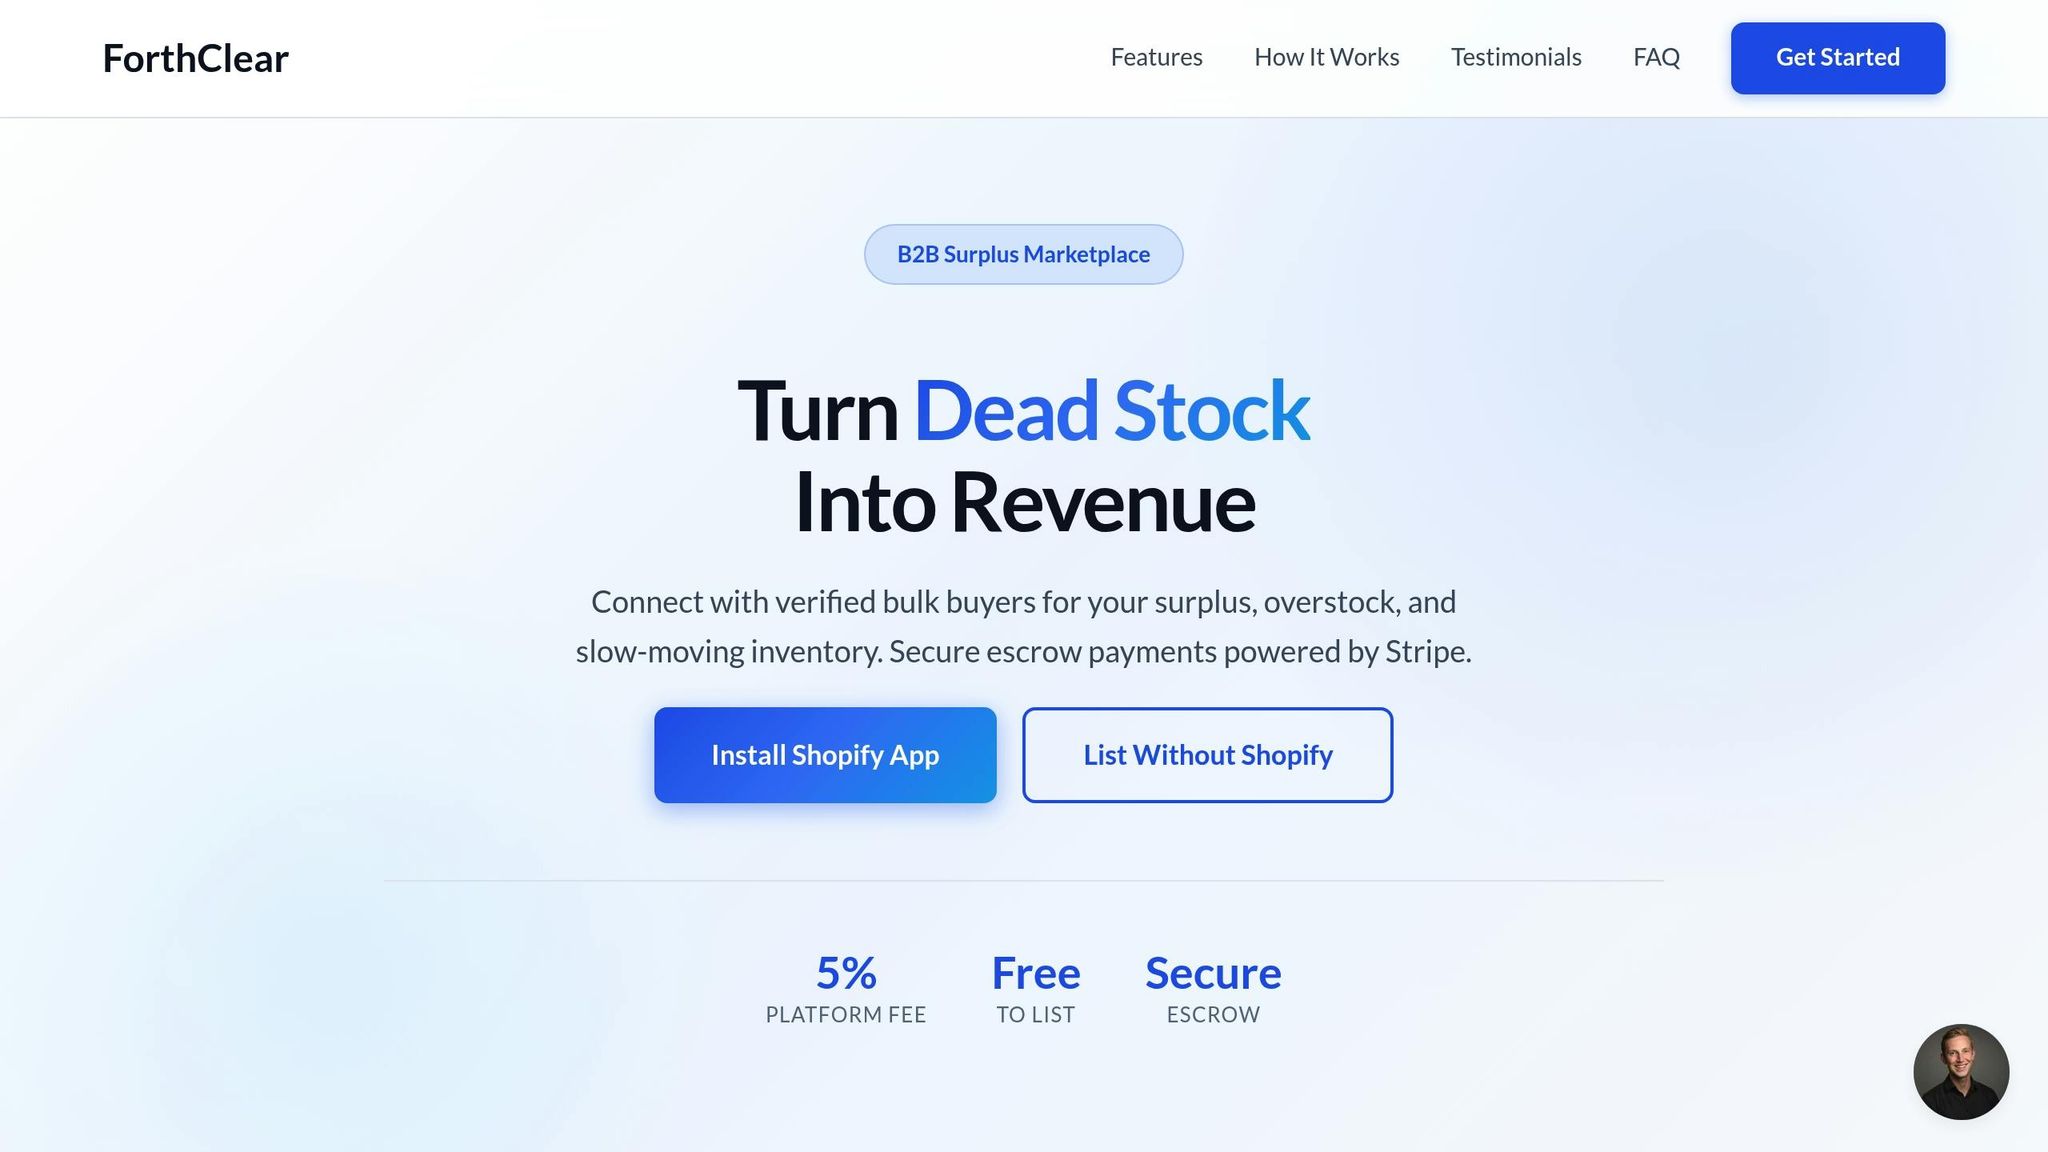
Automation can make the entire liquidation process smoother and more efficient, and that's where ForthClear comes in. This platform simplifies inventory management by automating key decisions and securing transactions. For example, ForthClear integrates seamlessly with Shopify to identify products that have been unsold for over 60 days, marking them as dead stock and enabling you to list them for sale in just minutes. This quick action helps minimize further depreciation by getting inventory to market faster.
ForthClear operates on a performance-based model, charging a 5% fee only when a sale is completed. Listing your products is entirely free. Buyers also benefit from the platform's secure Stripe escrow payment system, which holds funds until delivery is confirmed or after 14 days if no disputes arise. This added layer of security is especially valuable for high-value bulk transactions, where trust can often be a concern.
The platform also features a built-in messaging system that facilitates direct negotiations through quote requests. This allows you to respond to buyer interest in real time, counter-offer, and close deals more effectively. For international transactions, ForthClear provides tariff estimates, making it easier to expand into global markets. Businesses with large inventories can take advantage of bulk upload tools via CSV or Excel, which include an auto-image search to streamline the listing process by automatically locating product photos.
"ForthClear has revolutionized how we handle excess inventory. The secure payment system and quality suppliers have made our sourcing process incredibly efficient."
– Gordon Belch, Co-founder, vybey
"Easy to get started and offload some of our products that were nearing expiry date. Very helpful that ForthClear helps to find buyers in the process."
– Hylke Reitsma, Co-founder, vybey
Track Post-Liquidation Metrics for Better Results
After identifying and pricing surplus inventory, the next step is to dive into post-liquidation metrics. Why? Because the job doesn’t end once the inventory is sold. The real value lies in analyzing what happens after liquidation and using that data to fine-tune your strategy. Without tracking these metrics, it’s hard to know if your approach worked or if you missed out on potential revenue.
By leveraging strong data and consistent analysis, inventory management becomes an ongoing process that creates value over time. Instead of viewing each liquidation as a one-off event, you can establish a feedback loop. This loop helps you improve purchasing decisions, pricing strategies, and channel selections for future liquidations. In short, it’s about making smarter choices with every cycle.
Monitor Recovery Rate and Cycle Time
Two key metrics to keep an eye on are recovery rate and cycle time. These provide insight into how efficiently you’re handling surplus inventory.
- Recovery rate measures the percentage of the original cost you’ve recouped from liquidation. To calculate it, divide your liquidation revenue by the original cost, then multiply by 100. This shows how much financial loss you avoided by acting quickly, instead of letting inventory lose more value.
- Cycle time tracks how long it takes to move surplus inventory from identification to delivery. For example, if ForthClear’s Shopify integration flags products sitting unsold for over 60 days, cycle time measures the days from that point until the items are finally delivered. Shorter cycles mean faster capital recovery and lower carrying costs.
Another critical metric is the sell-through rate, which evaluates how well your pricing and channel choices are working. A low sell-through rate might signal pricing issues or a poor channel fit. Finally, track net recovery, which represents your revenue after deducting fees, shipping, and labor costs. This figure shows the actual cash you can reinvest.
Here’s a quick breakdown of these metrics:
| Metric | Definition | Why It Matters |
|---|---|---|
| Recovery Rate | (Liquidation Revenue / Original Cost) x 100 | Shows how effectively you’re minimizing financial loss |
| Cycle Time | Days from surplus identification to delivery | Highlights how quickly you’re freeing up capital |
| Sell-Through Rate | (Units Sold / Units Listed) x 100 | Measures demand in the secondary market |
| Net Recovery | Gross Revenue - (Fees + Shipping + Labor) | Reflects actual cash available for reinvestment |
Adjust Your Strategy Based on Performance Data
Once you’ve gathered post-liquidation metrics, use that data to refine your inventory strategy. For example, historical markdowns and obsolescence write-offs can act as a baseline for future evaluations. If certain product categories consistently yield low recovery rates, it might be time to rethink purchasing volumes or negotiate better supplier terms.
Compare recovery rates across various liquidation channels - like bulk marketplaces, direct liquidators, or internal discounting - to identify which ones provide the best returns. Platforms like ForthClear can also help you track quote conversion rates, offering insights into how often custom negotiations succeed. Adjust your bulk pricing tiers accordingly.
For more precise inventory management, monitor changes in demand or lead-time variability. If these shift by ±10%, recalculate reorder points, lot sizes, and safety stock levels. Additionally, maintaining a weekly KPI dashboard can help you track metrics like inventory turns, Days of Supply (DOS), and fill rates. For international sales, dive into cross-border transaction data and tariff estimates to pinpoint markets where your surplus might fetch higher prices.
Conclusion
Surplus inventory doesn't have to sit idle or drain your resources. By using data analytics, you can turn liquidation into a well-thought-out, profit-driven process. In fact, data-driven, multi-channel liquidation strategies typically deliver 18-22% higher recovery rates compared to older methods, while the cost of holding idle stock can climb to 25-30% annually.
The real game-changer is treating liquidation as a routine, integrated part of your operations - not just a last-minute clearance sale. By combining inventory tools, demand forecasting, and ABC analysis, you can quickly identify which items to liquidate, when to act, and how to prioritize. Incorporating secondary market insights and performance metrics further sharpens your strategy. Platforms designed for this purpose make the process even smoother.
Take ForthClear as an example. This platform simplifies liquidation with tools like automatic dead stock detection (flagging items unsold for over 60 days), secure Stripe escrow payments, and built-in tariff calculators for international sales. Features like bulk pricing options and real-time messaging make negotiations easier, while its verified buyer network ensures you're working with trusted businesses.
It's worth noting that 41% of businesses still rely on manual inventory management processes. Shifting to a data-driven approach can unlock working capital, protect your brand, and support sustainability efforts. As Umbrex aptly put it, "Robust data and disciplined analytics turn inventory optimization from a one-off project into a continuous value-creation engine".
Start by focusing on key metrics and scale up as you go. Acting quickly allows you to recover capital and create space for higher-margin products. This ongoing improvement cycle reinforces the data-driven strategies we've covered.
FAQs
How can data analytics help businesses manage surplus inventory effectively?
Data analytics helps businesses spot surplus inventory early by focusing on critical metrics like sales velocity (how many units sell each week or month) and inventory turnover (calculated as cost of goods sold ÷ average inventory). These metrics reveal which items are slow to sell and identify seasonal patterns, allowing businesses to address excess stock before it turns into a financial strain.
With advanced tools like predictive models and machine learning, companies can forecast demand and detect potential overstock weeks ahead of time. Techniques such as ABC/XYZ analysis further refine this process by categorizing inventory based on its value and variability. This makes it easier to decide which items should be marked down or liquidated. Acting on these insights quickly can help businesses cut waste, free up storage space, and turn surplus inventory into profit.
How does demand forecasting help with surplus inventory liquidation?
Demand forecasting empowers businesses to make smarter decisions about managing surplus inventory. By predicting how much of a product will sell and when, companies can move away from guesswork and take a more calculated approach. This means identifying and selling excess stock before it becomes outdated. The result? Lower holding costs, improved cash flow, and healthier profit margins.
It also helps align supply with real market demand, cutting down on overproduction and unnecessary waste. Tools like ForthClear leverage these insights to connect sellers with trusted buyers at the right time. This ensures surplus inventory is sold quickly, securely, and at competitive prices. In short, demand forecasting not only boosts efficiency but also reduces waste and helps businesses make the most of their inventory liquidation efforts.
How can businesses use data to select the best channels for surplus inventory liquidation?
Analyzing data is the first step in selecting the best liquidation channels for your products. Key metrics to consider include unit cost, product age, and sales performance. For instance, carrying costs alone can eat up 20-30% of a product’s value annually. By examining these factors, you can categorize inventory into fast-moving, slow-moving, or dead stock. This categorization helps pinpoint items that are depreciating quickly and need immediate attention.
Once you have this data, a break-even analysis becomes crucial. This analysis helps you calculate the minimum price needed to cover costs like storage, shipping, and platform fees. With this information, you can avoid channels that lead to losses and focus on those aligned with your profit goals. For example, high-value, fast-selling items might thrive on bulk buyer platforms, while older, low-margin stock could perform better with discount retailers or in export markets.
To keep improving, use real-time analytics to monitor pricing trends, buyer demand, and recovery rates. This approach allows you to fine-tune your strategy, minimize waste, and get the most value out of surplus inventory.